Infectious Disease Modelling using R
![]()
About Me
- Asst Prof, Dept of CFM @ AIIMS Bibinagar
- Domain Expertise:
- Public Health Data Science
- Spatial Epidemiology
- Infectious Disease Modeling
- R Educator

- Trained in Modern Modeling Techniques @ LSHTM, UK
- Member of R Epidemics Consortium (RECon), Imperial College, London, UK
- COVID-19 Testing Data — ICMR
What is a Model?
A simplified representation of a complex phenomenon.

All models are wrong, but some are useful.
— George E. P. Box
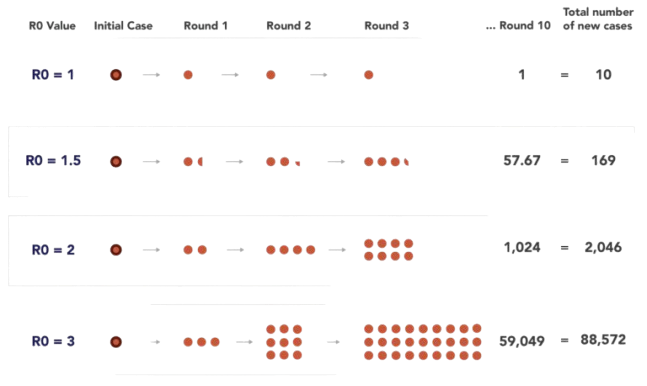
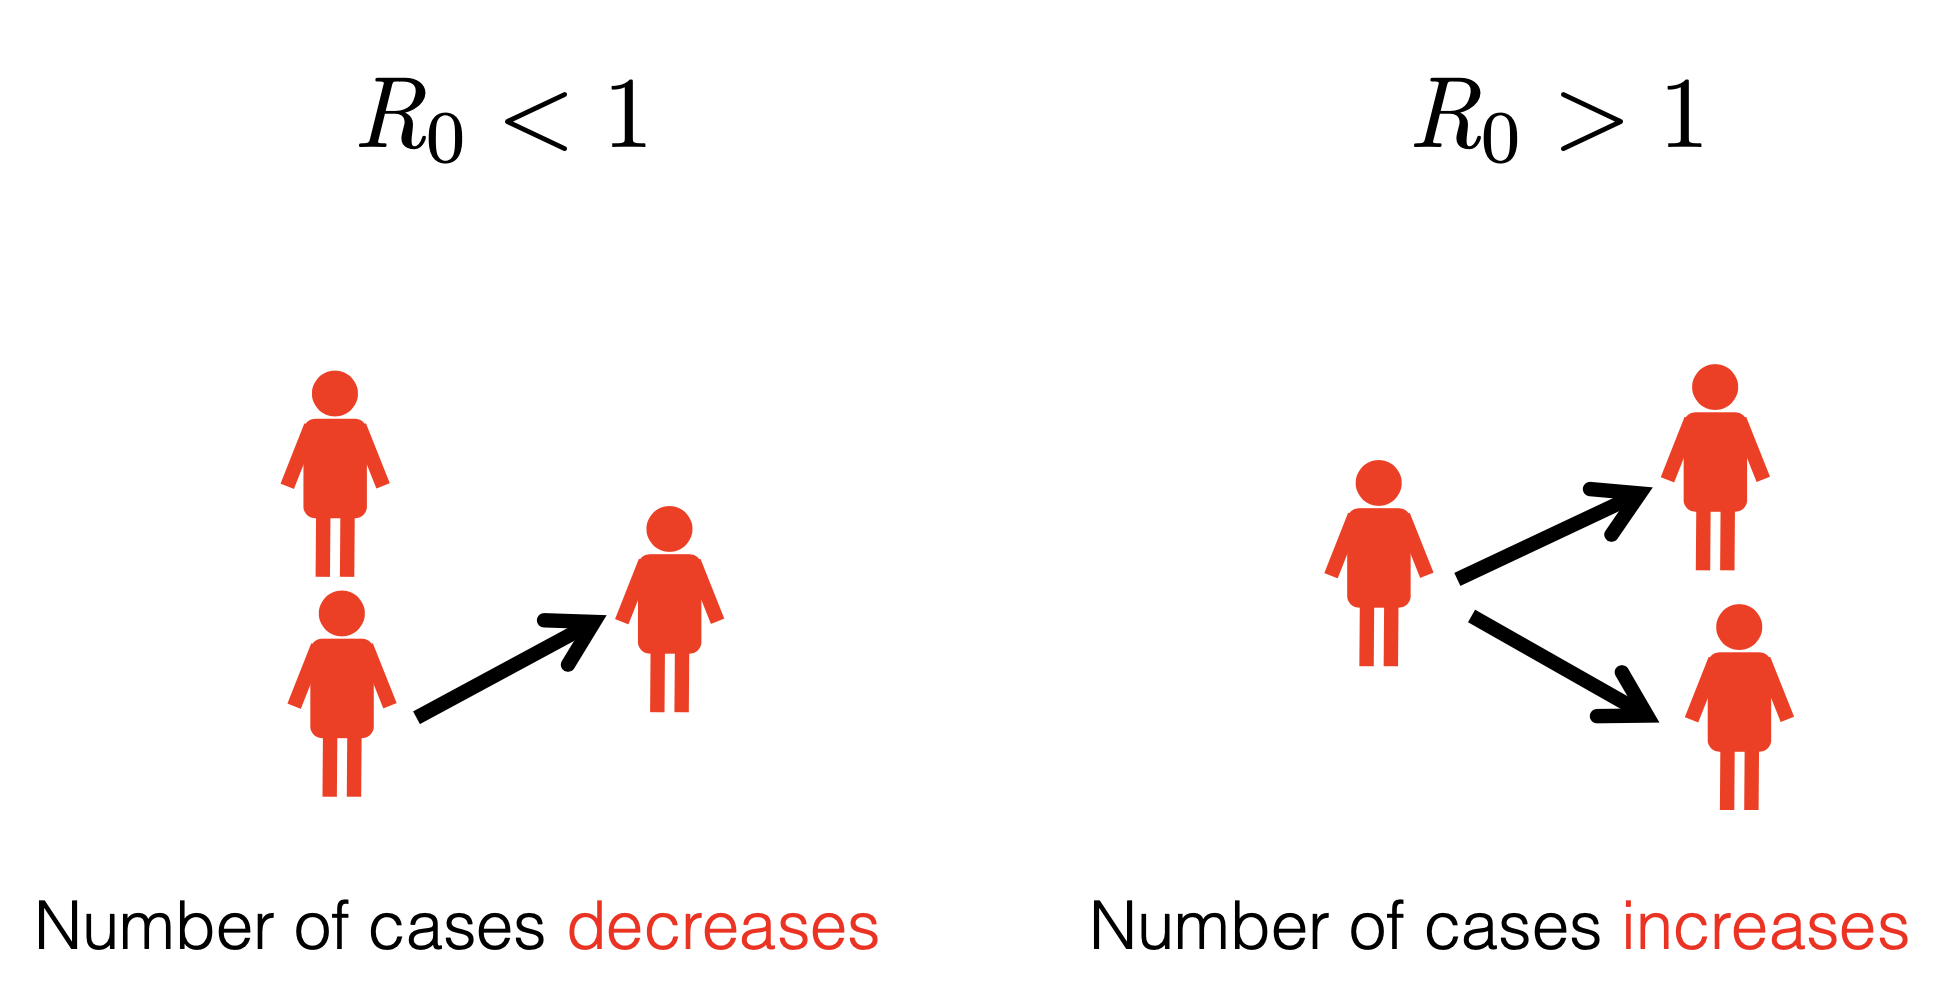
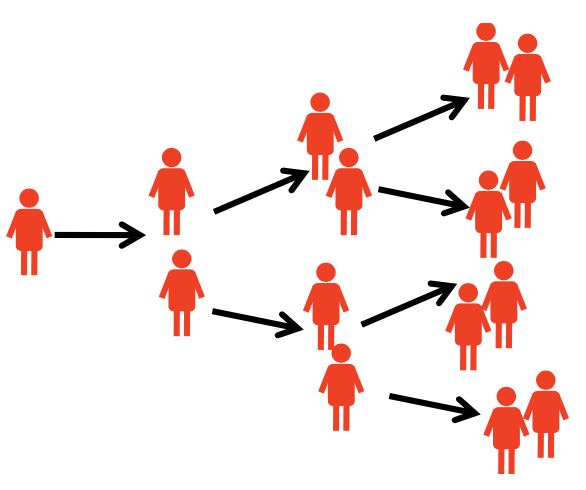
The Reproduction Number (R0)
Average number of secondary infectious persons resulting from one infectious person introduced into a totally susceptible population.
The number of secondary cases an infectious person generates.
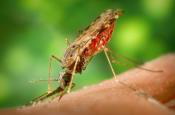
Rank these Diseases by R0

Measles
Malaria
HIV
Ebola